Elliott Wave Theory is a popular technical analysis tool used by traders to predict future price movements in financial markets. Developed by Ralph Nelson Elliott in the 1930s, the theory is based on the idea that market prices move in predictable patterns, which can be broken down into a series of waves. These waves are driven by the collective psychology and behavior of market participants.
Key Concepts of Elliott Wave Theory
- Wave Structure: Elliott Wave Theory identifies two types of waves: impulse waves and corrective waves.
- Impulse Waves (Motive Waves): These consist of five waves (labeled 1-2-3-4-5) that move in the direction of the prevailing trend. Waves 1, 3, and 5 are impulse waves, while waves 2 and 4 are corrective waves within the impulse. (Figure reference: https://www.mql5.com/en/articles/260 )
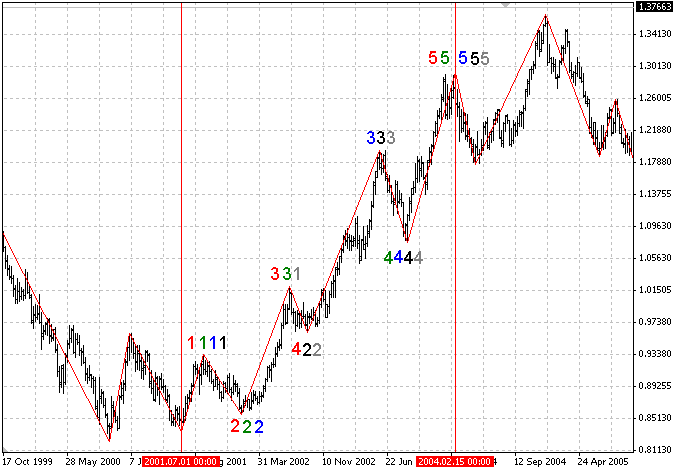
- Impulse Waves (Motive Waves): These consist of five waves (labeled 1-2-3-4-5) that move in the direction of the prevailing trend. Waves 1, 3, and 5 are impulse waves, while waves 2 and 4 are corrective waves within the impulse. (Figure reference: https://www.mql5.com/en/articles/260 )
-
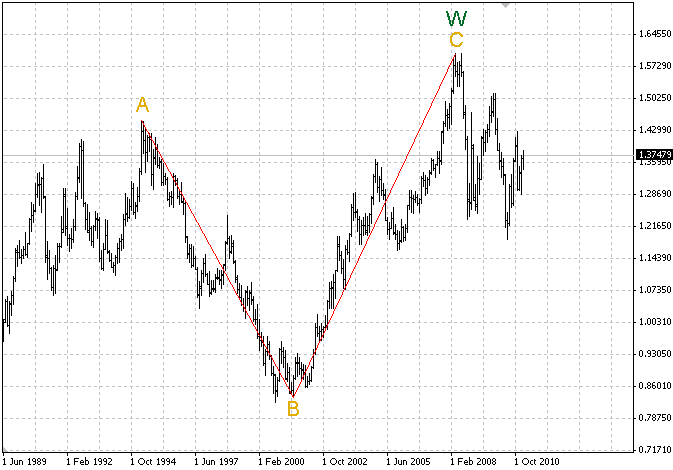
- Corrective Waves: These consist of three waves (labeled A-B-C) that move against the trend, typically retracing a portion of the previous impulse wave. (Figure reference: https://www.mql5.com/en/articles/260 )
- Wave Cycles:
- Waves operate in cycles across different time frames. A complete cycle consists of eight waves: five impulse waves followed by three corrective waves. This pattern repeats on both macro (long-term) and micro (short-term) levels, creating fractal-like structures.
- Wave Degrees:
- The theory classifies waves into various degrees based on their time frame, from grand super cycle waves (lasting several decades) to minuette waves (lasting just minutes or hours).
- Wave Characteristics:
- Wave 1: Often the smallest, as it’s the beginning of a new trend.
- Wave 2: Typically retraces a significant portion of Wave 1.
- Wave 3: Usually the strongest and longest wave, often extending well beyond the end of Wave 1.
- Wave 4: A corrective wave that often retraces less than Wave 2 and tends to be shallow.
- Wave 5: The final wave of the impulse, which may show signs of divergence (price makes a new high, but momentum does not).
- Wave A: The first corrective wave, which moves against the primary trend.
- Wave B: A counter-trend wave that often retraces part of Wave A but does not reach new highs or lows.
- Wave C: A continuation of the corrective phase, often stronger than Wave A.
- Fibonacci Relationships:
- Elliott Wave Theory often integrates Fibonacci retracement and extension levels to forecast wave targets, as these mathematical ratios frequently appear in wave structures.
- Application
- Traders use Elliott Wave Theory to identify potential market reversals, continuation patterns, and to set price targets. While subjective and requiring practice to apply correctly, the theory can provide a powerful framework for understanding market cycles and crowd psychology.
- Traders use Elliott Wave Theory to identify potential market reversals, continuation patterns, and to set price targets. While subjective and requiring practice to apply correctly, the theory can provide a powerful framework for understanding market cycles and crowd psychology.
- Limitations
-
- Despite its popularity, Elliott Wave Theory is criticized for being highly interpretive, as different analysts might label the same price action differently. Additionally, the accuracy of predictions can vary based on the analyst’s skill in identifying waves and market conditions.
Overall, Elliott Wave Theory is a valuable tool for those who understand its principles and are comfortable with its subjectivity.